
Lever One: The Sales Engine
A practical guide to drive growth without running off a cliff.

In recent conversations with partners, one theme keeps surfacing: the importance of understanding Sales Efficiency. Put simply, this is the cost of acquiring an order or customer relative to the value they generate. It’s not a niche metric. It’s the single most important lens for forecasting revenue, identifying what actually drives growth, and building a company that can sustain itself year after year.
This article marks the start of my Small Business Growth Series: Levers for Growth. The goal is to give founders and operators practical frameworks and playbooks for building businesses that compound: businesses that support your family, your team, your community, and ultimately your financial future.
Why Build a Sustainable Sales Engine?
Imagine the familiar scene: you’re at the Courtyard Marriott bar after another trade show, entering business cards into your laptop with an Old Fashioned in hand. You’ve spent $2,000 on conference fees, $2,500 on travel, $1,500 on marketing materials, and lost several days of fulfillment work. In return, you estimate about $20,000 in potential revenue, realistically closer to $15,000 once everything shakes out. After all that effort, you’ve bought yourself roughly one more month of runway, along with a few inevitable late nights.
Now consider a different version of the same investment decision. Instead of spending nearly $6,000 and several days of labor to hope for $15,000 in eventual revenue, you invest $10,000 across your sales team, advertising, and conferences, and reliably see $35,000 of revenue hit your P&L. The same intent, to generate business, but with predictable and data-backed outcomes. That is what a Sales Engine creates: a consistent, measurable relationship between the dollars you put in and the revenue you can expect to get out.
It gives you the ability to throttle growth up or down as operations evolve. It helps you forecast inventory requirements with confidence. Most importantly, it aligns financial strategy with growth strategy so the business becomes more stable, more scalable, and far less chaotic.
A well-built Sales Engine keeps you from sprinting off the cliff like Wile E. Coyote. Instead, you see the terrain ahead, plan your path, and grow with intention.

Key Concepts
Borrowing from my friends in Venture Capital, experts in “growth-at-all-costs”, there are a few terms that don’t leave the walls of Silicon Valley nearly often enough: CAC, LTV, AOV/ACV, and SER. Finance loves its gate-keeping language, but these metrics are foundational if you want to understand the economics of a scalable Sales Engine.
Let’s break down each concept and how it shows up in real decision-making.
Customer Acquisition Cost (CAC)
This is the average cost of acquiring a new customer, that is the total amount spent on marketing and sales efforts (directed at new customers) relative to the number of customers acquired.
I also often look at Order Acquisition Cost (OAC) in tandem with CAC. OAC measures the cost to acquire any order (including repeat customers), which tends to matter more for e-commerce clients where returning customers meaningfully lower blended acquisition costs.
CAC = (Total Sales & Marketing Cost)/(Number of Customers Acquired)

For example: A company that acquired 1000 customers last year and spent $50,000 on Sales & Marketing has a CAC of 50.

Pro Tip: CAC becomes dramatically more meaningful when you break it down by channel. Your “blended CAC” may look healthy, but individual channels often hide inefficiencies. Tracking CAC by channel (paid social, paid search, referrals, partnerships, outbound, etc.) helps you double down on profitable acquisition paths and shut off the ones silently burning cash.
Lifetime Value of Customer (LTV)
LTV measures the total revenue you expect from an average customer over the full duration of your relationship with them. It captures not just the first purchase, but the entire economic contribution a customer makes over time. For many businesses, especially e-commerce, LTV is the financial backbone of predictable growth. It tells you how aggressively you can acquire customers, how long it takes to recover acquisition costs, and how much working capital you can confidently deploy.
The key insight is that customers rarely behave in a single transaction. They rebuy, upgrade, reorder consumables, respond to promotions, join loyalty programs, or develop purchasing habits that compound their value. A properly measured LTV reflects these patterns and gives you a realistic picture of what a customer is actually worth, not just what they spend on day one.
LTV = Sum of All Revenue from the average Customer

For example: Our Average customer spends $500 per order and orders every 6 months for an average of 2 years. This means we have an LTV of $2,000.

* Pro Tip: For product companies, evaluating LTV on a gross margin basis often tells a more accurate story. Using the example above:

Revenue LTV = $2,000
At 75% gross margin → $1,500 true margin LTV

This is the number that actually funds growth.
Average Order Value (AOV) / Average Contract Value (ACV)
AOV (common in D2C) and ACV (common in B2B) represent the average dollar amount a customer spends per purchase or per contracted period. These metrics help you understand customer behavior, revenue composition, and how efficiently you can afford to acquire customers..
AOV = (Total Revenue) / (Number of Orders)
ACV = (Total Contract Value) / (Number of Contracts)

For example: An ecommerce store generating $200,000 from 2,500 orders has an AOV of $80. A B2B startup closing $500,000 across 10 annual contracts has an ACV of $50,000.

* Pro Tip: When AOV or ACV is low, CAC must also stay low or you’ll burn cash fast. Increasing AOV/ACV (through bundling, upsells, pricing strategy, or contract expansion) is typically one of the highest-leverage ways to improve unit economics.
Sales Efficiency Ratio (SER)
SER deserves far more airtime outside of venture-backed startups. It measures how efficiently your Sales & Marketing spend converts into new gross margin, not revenue.
SER gives you a clear read on whether your growth model scales.
It’s also worth noting that I treat SER as a holistic efficiency metric (including salaries and overhead), while CAC is more marginal and often excludes fixed costs.
SER = (New Gross Margin Generated) / (Sales & Marketing Spend)

For example: If your company spent $100,000 on Sales & Marketing in Q1 and generated $250,000 in new gross margin during the same period, your SER is 2.5x. In other words, every $1 spent produced $2.50 in new gross margin. 2-3x is healthy, if you're well above that it means that you're under leveraging your sales engine, and if you're below it means you need to drive more value or improve sales efficiency.

* Pro Tip: Investors love SER because it provides a quick read on the scalability of your growth engine. A ratio above 3.0 generally signals efficient growth; below 2.0 usually means you’re spending more to acquire gross margin than it's initially worth. Strong companies improve SER over time as their brand, product, and go-to-market motion mature.
Venture Math: Investing in Growth
As I often preach to my partners, as a small business owner, you are an investor first and an operator second. After all, you’ve bet your life on the company, sometimes mortgaging your house, and certainly sacrificing the most scare resource of all, time. Given this, it’s crucial that you understand the math that growth-oriented investors are running to protect their investment while maximizing returns on capital.
Depending on your line of business, a few comparisons should drive your decision making:
LTV < CAC: If the cost to acquire a customer is lower than the lifetime value of that customer, you have a fundamental business problem. This is likely from Product Market Fit limitations but also may be a function of poor efficiency. When counting these, it’s important to be really thoughtful of the true costs.
For example: If you’re making $300 per customer and it only cost you $50 in Ads to acquire that customer, it may seem value accretive, however if you’re spending 15 hours per week creating Instagram content, the true economics may be much less favorable. LTV > CAC: If your customers are worth significantly more than it costs you to acquire the customer, you should continuously invest in acquiring new customers since you expect to recover this value in the long run. One area that often goes overlooked is the situation where the first order is not profitable, but the lifetime relationship is.
For example: It costs $100 to acquire a customer and only make $80 of gross margin on that customer. Often between your brand and email channels the company has a great retention/retargeting strategy where it costs only $5 per additional order.

Order 1 | Gross Margin = $80 | Cost to Acquire = $100 | Total Gain/Loss = -$20
Order 2 | Gross Margin = $80 | Cost to Acquire = $5   | Total Gain/Loss = +$55

This is the power of understanding your LTV; by understanding customer behavior you can invest in growth that isn't immediately obvious.
AOV/ACV > Order Acquisition Cost: Assuming a reasonable working capital dynamic, if your Average Order Value/Average Contract Value is greater than your single Order Acquisition Cost (OAC), you can reasonably continue to spend to drive more growth up until your OAC = AOV. While there is nuance here with Gross margin, this gives you a lever to grasp at the economies of scale that come with higher volumes to drive higher profitability.
For example: Let’s say it costs you $40 in advertising and sales effort to acquire a single order (your OAC), and the Average Order Value (AOV) for that customer is $75. Even before layering in retention or repeat purchase behavior, you are generating more revenue per order than you are spending to acquire that order. As long as gross margin is healthy (say 60–70%), you have room to scale this channel.

AOV: $75 | Gross Margin (70%): $52.50 | OAC: $40
Net Contribution per Order: $52.50 – $40 = $12.50

This means every incremental dollar you put into this acquisition channel is producing a positive contribution today, not just in the lifetime value model. You can safely continue spending up to the point where your OAC climbs toward your AOV. As volume increases, ad efficiency often improves, vendor costs decline, and operational scale increases—further widening that positive gap.

This dynamic is a core engine behind profitable scaling: when AOV comfortably exceeds OAC, growth becomes a financial decision rather than a leap of faith.
SER > 2: If your Sales Efficiency Ratio is consistently greater than 2, you are generating at least $2 in new gross margin for every $1 you spend on Sales & Marketing. This is the moment when growth-oriented investors start smiling. A strong SER indicates that your sales engine is both efficient and scalable, meaning you have room to safely dial up spending to increase revenue without jeopardizing profitability.
A high SER often means that your brand is resonating in the market, your sales team is effective, and your retention or expansion motions are functioning properly. In this environment, strategic investment into sales channels, people, technology, or performance marketing often produces asymmetric returns.
For example:
Your company spends $50,000 this quarter and generates $130,000 in new gross margin. Your SER is:

SER = 130,000 / 50,000 = 2.6

This suggests you’re leaving profitable opportunities on the table. You could likely increase your Sales & Marketing spend to accelerate growth, as long as operational capacity (production, customer support, fulfillment) can absorb the increase.

If your SER rises materially above 3–4x, it may actually be a sign that you’re under-investing in growth. Your sales engine is working, but you’re not feeding it enough volume to maximize its output.
Case Study: Turning Data Into a Scalable Sales Engine
One of my favorite examples of building a true Sales Engine comes from a client I’ve worked with over the past year, a product company with strong organic traction but no reliable way to forecast revenue or justify meaningful investment in growth. Like many founders, they were hustling their way to each next month, unable to confidently answer the question: If I spend $X on sales and marketing, what do I get back?
When we started, the numbers looked like this:
AOV: $150
Gross Margin: 50% (Transitioning to 75% with investments in lower unit costs)
CAC: $50
LTV: $1,800
Order Acquisition Cost (OAC): $30 blended across new and returning customers
These are strong fundamentals, but they were hidden beneath a lack of visibility. So, we built the visibility.
Collecting the Data
The first step in building a Sales Engine is simple, but not easy: you must know what is actually happening inside your business. For this client, we started by running a cohort analysis, which is just a fancy way of saying we grouped customers by the month (or channel) they first purchased and tracked their behavior over time. Cohorts reveal patterns that topline revenue can’t: repeat purchase cycles, contribution by customer segment, and whether retention is improving or degrading.
Alongside that, we:
Implemented proper attribution tracking so we knew which channels were driving sales and at what cost.
Built a weekly scorecard with CAC, AOV, gross margin, SER, and retention indicators.
Measured OAC separately from CAC to monitor the blended efficiency of returning vs. new customers.
Ran controlled experiments with ad spend based on hypotheses we developed from the data.
A Sales Engine isn’t magic, it’s disciplined testing, consistent measurement, and removing the guesswork. It’s truly just Business as a Science.
Optimizing the Revenue Model
As we collected cleaner data, we spotted opportunities. For instance, the client’s AOV had room to grow. By introducing incentives like free shipping at a $200 cart threshold, we nudged the AOV from $150 to $185, a massive lift to our cashflow, especially at scale.
At the same time, we saw that LTV, which was already strong at $1,800, could be significantly improved as margin expanded. When the company invested in tooling and transitioned to better manufacturing processes, we watched margins rise from 50% to 75%, instantly increasing the financial leverage of every customer acquired.
Using the Engine to Unlock Capital Investment
Here’s where things get fun. Once the Sales Engine was in place, meaning we had reliable, data-backed unit economics, we were able to ratchet up ad spend confidently. We could now show, with data:
If we spend $1, we get $4-$5 in gross margin.
Here’s the range of outcomes based on historical variance.
Here’s how long it takes for a cohort of customers to repay its acquisition cost.
That predictability allowed us to do something many small businesses struggle with: secure financing for tooling and manufacturing investments.
Because we could demonstrate consistent return on spend and forecast revenue with meaningful accuracy, our manufacturing partner was willing to support large CapEx for injection molding tooling since we were executing a predictable model.
And because we knew how much revenue we could generate per advertising dollar, we were able to purposefully toggle spend, move inventory faster, shorten the sales cycle, and proactively manage inventory rather than react to it.
Scaling With Eyes Wide Open
Today, this partner’s growth isn’t guesswork. It’s a system. As we scale, we’re constantly testing assumptions using the same methodology I outline in another article, “The risk is in the darkness, not the leap.”
In other words, risk doesn’t come from moving quickly, it comes making decisions blindly. By bringing data into the light, we built a growth strategy the founder can trust because it’s measurable.
Implementation Tactics: How to Build Your Own Sales Engine
A Sales Engine is built through clear data, simple modeling, and steady iteration. The goal is reliable predictability. You want to reach a point where you can say, “If I spend $X, I can expect $Y in return,” and have the numbers to support the decision.
Below is the framework I use with partners to create that level of visibility and control.
Step 1: Gather Clean, Decision-Ready Data
Most small businesses struggle with forecasting because they don’t have enough clarity on what is driving results. Before you optimize anything, you need accurate information about customer behavior and channel performance.
Start with the fundamentals:
Cohort Analysis: Group customers by the month (or channel) of acquisition and track how they behave over time. This reveals retention trends, purchase frequency, and the true value of each customer segment.
Channel-Level Attribution: Understand which channels are producing customers and at what cost. Guessing here leads to wasted spend. I religiously track my introductions and touchpoints in HubSpot for B2B sales and strongly advocate to my e-commerce clients to improve attribution infrastructure with software like Triple Whale.
Weekly Scorecard: Track CAC, AOV, gross margin, SER, OAC, and retention indicators every week. Consistent reporting creates focus and accountability. The name of the game is trends and rapid feedback to action, rather than absolutely perfection.
Segmentation: Separate new and returning customers to understand blended efficiency and long-term contribution.
This foundation allows you to treat your business as a working system rather than a series of disconnected activities.
Step 2: Build a Simple Revenue Model
Your revenue model should translate inputs into outputs in a way that helps you make real decisions. As I’ve personally had to learn with time, complexity doesn’t make it better however simplicity does.
Focus on a few core relationships:
Spend → Traffic
Traffic → Orders
Orders → Gross Margin
Add reasonable sensitivity ranges to understand how changes in CAC, conversion rate, or AOV affect the model.
Finally, incorporate cohort repayment timelines, which tell you how long it takes for customers to recover their acquisition cost. This becomes critical when planning cash needs. If it turns out to be the very first order, stress test the model to see what you could reasonably push CAC to before it breaks your LTV, this will give you the guardrails to be more aggressive with your experimentation.
A functional model gives you confidence in your growth decisions and establishes a baseline for testing.
Step 3: Calibrate With Controlled Tests
Once you know your baseline economics, begin testing scenarios for your sales and marketing inputs. The goal is to validate or refine your assumptions.
A practical approach is to:
Increase S&M spend by 10% to 20% at a time.
Track CAC, AOV, and OAC weekly to see the impact.
Compare forecasted results to actuals.
Adjust assumptions based on the patterns you see.
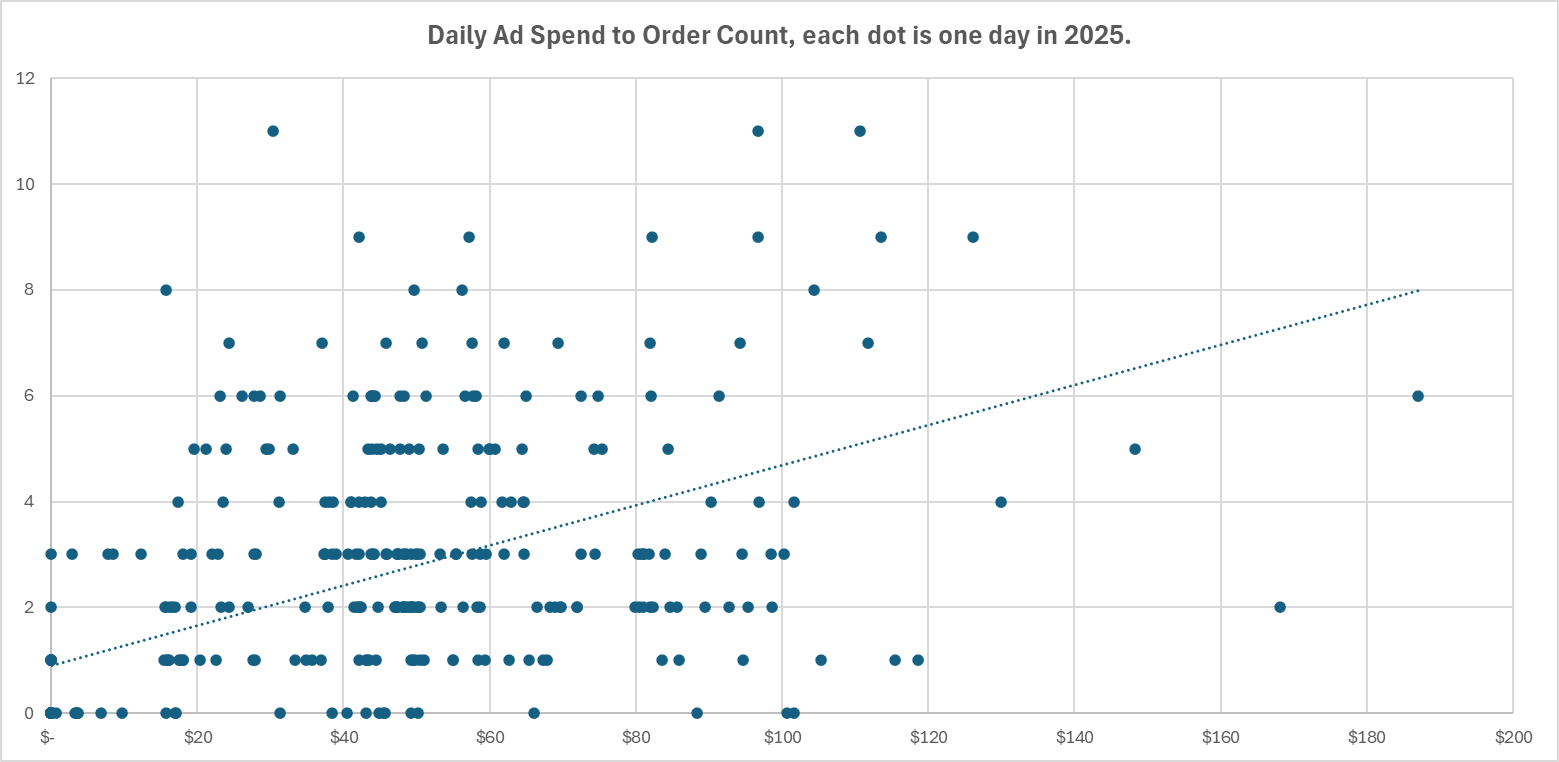
I love visual charts for this process, for example, here was an early visualization that helped us form an initial hypothesis for higher daily Ad spend. The weekly data (which I couldn’t find unfortunately) shows an even stronger correlation.
This calibration phase builds trust in the numbers. You begin to understand the relationship between dollars invested and dollars returned.
Step 4: Allocate Capital Based on Performance
When your numbers stabilize, you can begin allocating more capital toward the parts of your engine that consistently generate returns. This is where the business shifts from reactive to strategic.
Key actions include:
Increasing investment in channels that produce healthy SER and contribution margins.
Reducing or eliminating spend in channels with poor returns.
Using predictable results to negotiate better manufacturing terms, secure financing, or justify larger CapEx investments.
Predictability strengthens your position with partners and allows for more intentional growth.
Step 5: Turn the Engine into a Weekly Discipline
Like any system, a Sales Engine must be maintained. The goal is to keep the system aligned as conditions change.
Embed the following into your rhythm:
Weekly performance reviews
Monthly forecasting updates
Quarterly assumption resets
Continuous testing of channels, offers, pricing, and creative
This keeps your growth strategy grounded in data rather than intuition and ensures the engine stays healthy as you scale.
Red Flags That Signal Your Sales Engine Needs Attention
A strong Sales Engine will give you consistency, predictability, and confidence. When it starts drifting, the early warning signs are usually clear if you know where to look. These are the red flags that matter most, the ones that almost always indicate something in the system needs attention.
1. CAC Rising Faster Than LTV
If your Customer Acquisition Cost grows faster than your Lifetime Value of Customer, the gap that funds your growth disappears. This is one of the earliest signs that a channel is losing efficiency, the offer has gone stale, or the market is shifting. When the spread tightens for more than a few weeks, pause and re-evaluate the core drivers of demand.
2. SER Dropping Below 2 for More Than a Short Period
Your Sales Efficiency Ratio reflects the health of your growth engine. A SER consistently below 2 means you are spending too much to generate gross margin and are likely consuming cash rather than creating it. This signals the need to reassess channel mix, creative fatigue, margin structure, or customer quality.
3. Forecasts Consistently Miss Reality
If forecasts are regularly off by 20–30 percent or more, one of your assumptions is out of date. This could be CAC instability, AOV shifts, a change in repeat purchase behavior, or inaccurate attribution. Consistent misses erode confidence and make planning difficult, especially around inventory, staffing, and cash management.
4. Margin Decline Without Operational Change
When margins shrink despite stable production costs, the cause is almost always higher discount pressure, smaller order sizes, or an acquisition strategy that is attracting lower-value customers. This red flag is easy to overlook because revenue may still appear healthy, but the business becomes less resilient with each period.
5. Inventory Becomes the Limiting Factor
When you routinely run out of inventory or consistently over-order, the Sales Engine isn’t aligned with operations. Either demand is not being forecasted accurately, or spend is being adjusted without visibility into production timelines. This misalignment creates unnecessary cash strain and limits growth potential.
The Entrepreneur→ Investor Mindset Shift
Building a Sales Engine is not just a financial exercise. It requires a shift in how you think about growth, risk, and decision-making. Most entrepreneurs start by relying on instinct and hustle, which is the most necessary thing in the earliest stages, but instinct has limits. Systems scale; intuition alone does not.
The mindset shift is moving from reacting to results toward engineering them.
When you begin treating Sales and Marketing as investments rather than expenses, you gain a new level of control. Each dollar becomes a strategic tool you deploy with intention, supported by data and clear expectations. Instead of asking, “Can we afford to spend this?” you start asking, “What return should we expect if we spend this?”
This shift also reduces the emotional weight that so often comes with running a small business. Forecasting becomes clearer. Inventory planning becomes manageable. Capital conversations become easier to navigate because they are backed by evidence, not optimism. You don’t eliminate uncertainty, but you dramatically reduce the areas where it can hide.
A well-built Sales Engine gives founders something they rarely talk about but deeply need: breathing room. It creates the capacity to think strategically, invest in people, and build a healthier and more resilient company rather than living month to month.
If you’re working to build this level of predictability in your business, or you’re unsure where the gaps in your current engine may be, this is the kind of work I support entrepreneurs with every day. You can follow along and go deeper in future articles by subscribing to Conduit of Value, and if you ever want to explore what this looks like inside your business, feel free to reach out.